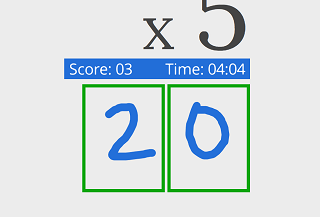
Multiply

For Joshua.
Charts
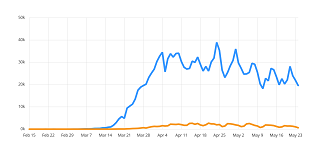
line, bar, and pie charts
Particles

A satisfying particle demo.
Ultimate Tic-Tac-Toe

A more sophisticated version of the game.
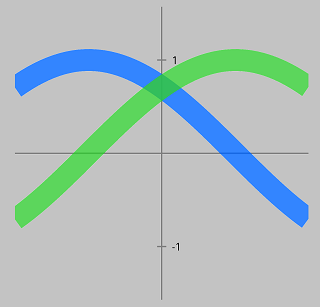
Bezier

Visually see how a bezier curve is plotted. Adjust the curve by moving the control points.
Mandelbrot Set

Plot the Mandelbrot and Julia sets.
MNIST
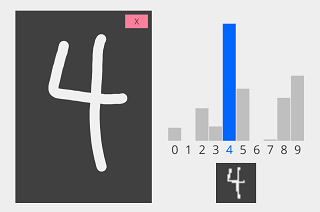
A convolutional neural network that has been trained to classify hand written numbers (0-9).
Color Picker
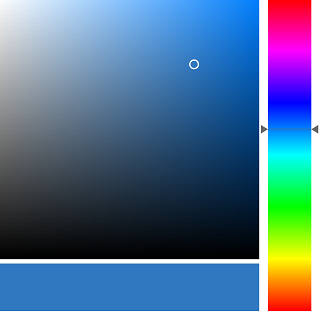
Color selection providing HSL, HSV, RGB, and HEX values.
Line Width
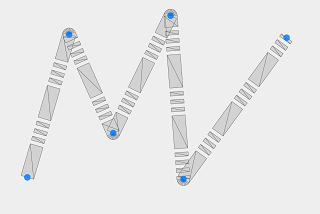
By default WebGL does not support any line width other than 1. This demo uses custom logic to draw 2D lines in WebGL